


You spent months and real money winning a customer. The pitch, the onboarding, the first good experience. Then one quiet quarter they’re gone, and the first you hear of it is a number on a dashboard that ticked the wrong way. Nobody rang an alarm. There was no argument, no complaint, no obvious moment it went wrong. That silent, no-warning departure is what makes customer churn so expensive, and so frustrating to fix.
The number itself is easy to produce. The hard part is that a churn rate tells you the loss already happened. It doesn’t tell you why, and it doesn’t tell you in time to do anything about the customers you’re about to lose next. This guide covers how to calculate churn properly, why the metric alone will never explain itself, and how to find and close the experience gaps that actually drive people away.
What is customer churn?

Customer churn is the rate at which customers stop doing business with you over a given period. It is the mirror image of retention. If you keep 92% of your customers this quarter, you churned 8%. It can be measured on the number of customers lost. Or on the revenue those customers represented, and the two often tell very different stories.
Churn matters because keeping customers is far cheaper than replacing them. Harvard Business Review reports that acquiring a new customer is five to 25 times more expensive than retaining one, and Bain & Company’s Frederick Reichheld found that increasing retention by just 5% can raise profits by 25% to 95%. In other words, a small dent in churn is one of the highest-leverage things a brand can work on.
How to calculate churn rate (with a worked example)
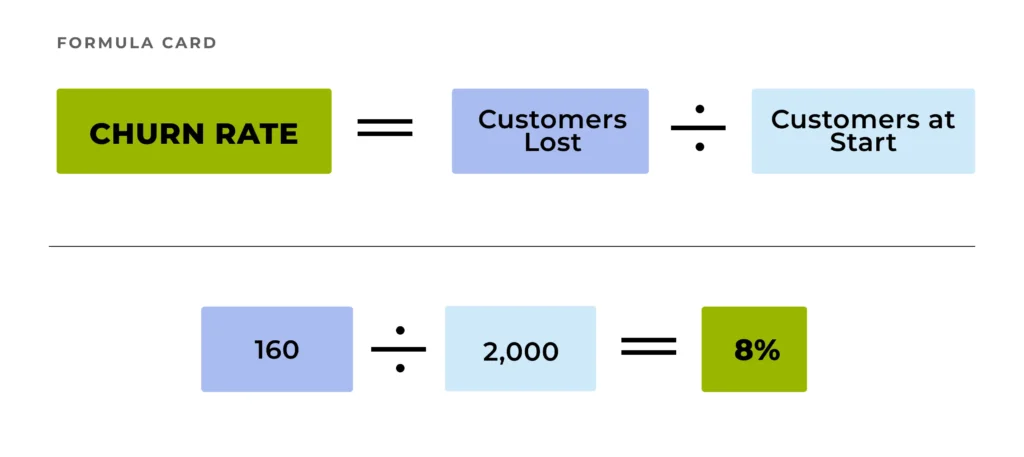
The basic formula is simple. Take the customers you lost during a period and divide by the customers you started with.
Churn rate = customers lost during the period / customers at the start of the period.
Let’s say you begin the quarter with 2,000 customers and end with 1,840. Having lost 160 of the original group. Your churn rate is 160 / 2,000, which is 8% for the quarter. Retention is the other 92%.
Two things trip people up here. First, decide whether you count only the customers you started with, or also new customers who joined and left inside the same period. Mixing new sign-ups into the denominator flatters the number and hides how many established customers are actually leaving. Keep the measure clean and consistent so you can compare it period over period. Second, pick a period that matches your business. A bank or a subscription looks at monthly or annual churn. A restaurant group thinking in terms of lapsed regulars might look across a longer window.
Gross churn, net churn, and revenue churn
Counting logos lost is only half the picture. The same 8% can be healthy or alarming depending on which customers left and what they were worth.
Customer churn counts how many customers you lost. Revenue churn weights that by value, and it is usually the number that matters more. Losing 160 low-value customers is not the same as losing your ten biggest accounts. Even if the customer-churn percentage looks identical.
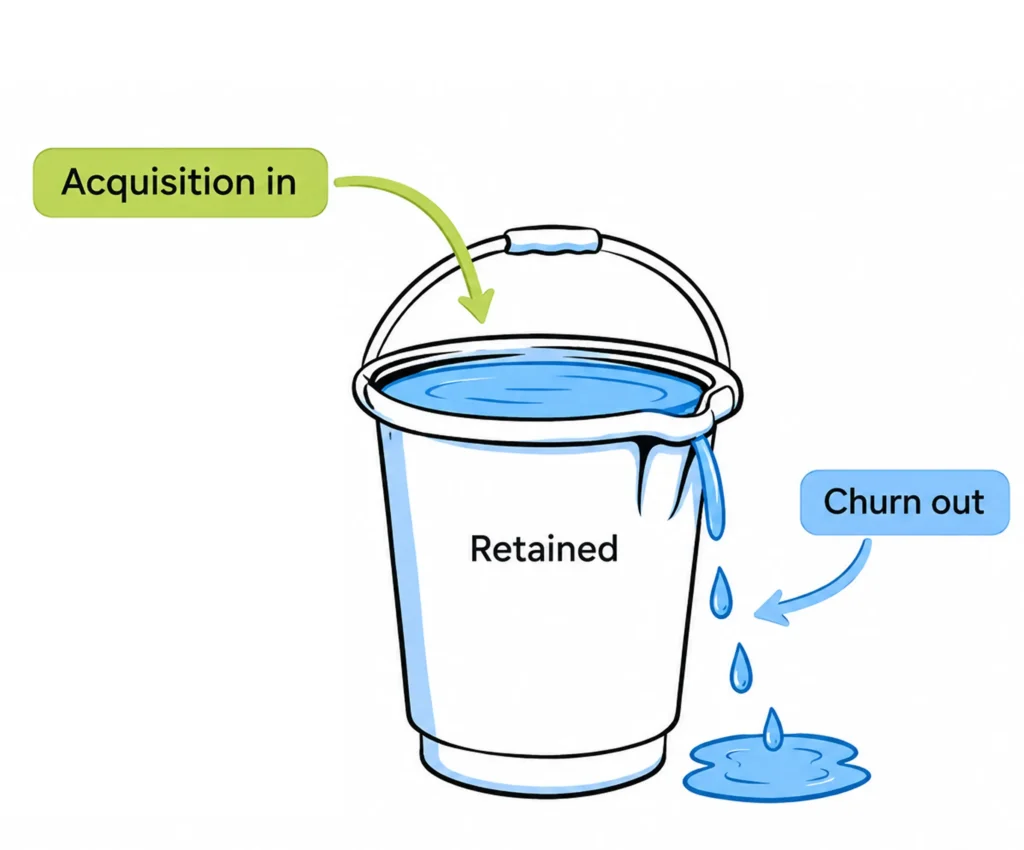
Gross revenue churn is the revenue lost from cancellations and downgrades. Net revenue churn subtracts the extra revenue you gained from customers who stayed and spent more. If your existing customers grow their spend faster than others leave, net churn can even go negative, which is a genuinely strong signal. Watching gross and net side by side tells you whether you have a leaking bucket, a growing one, or both at once.
Why your churn rate never tells you why
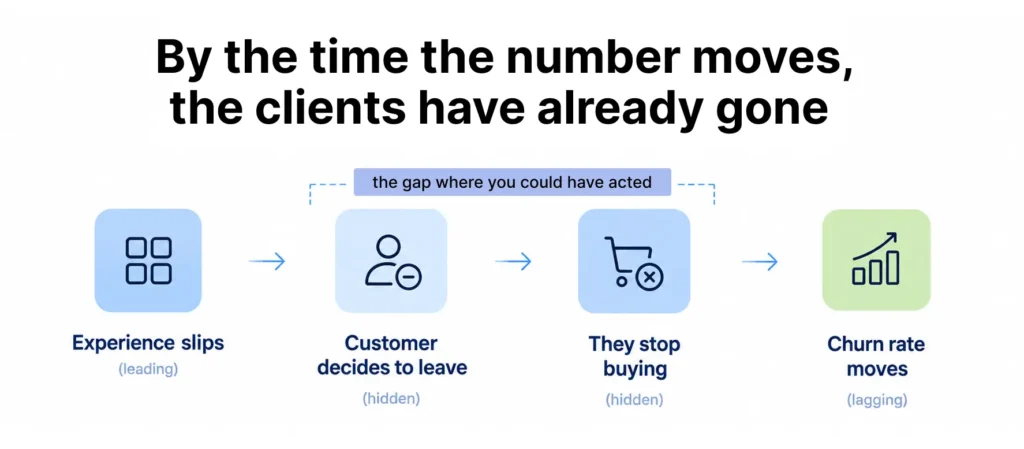
Here is the honest limit of the metric. A churn rate is a lagging indicator. It confirms a loss after it has happened, like reading yesterday’s weather. By the time the number moves, the customer has already decided, already left, and already told their friends.
It also flattens very different problems into one figure. An 8% churn caused by a broken onboarding flow needs a completely different fix from an 8% churn caused by rude service at three underperforming locations. Or by a competitor undercutting you on price. The number is the same. The cause and the cure, are not. Chasing the rate without knowing the driver behind it is how teams spend a quarter fixing the wrong thing.
Worse, a low churn number can hide dissatisfaction rather than disprove it. Customers locked into a contract or a loyalty scheme may stay on paper while quietly planning to leave the moment they can. The score looks fine right up until it doesn’t.
How to find the real reasons behind churn
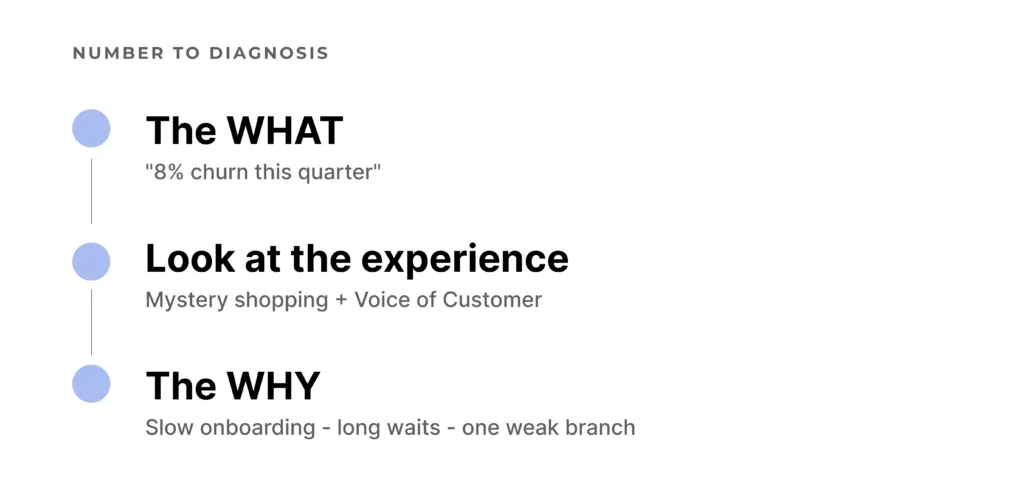
To reduce churn you have to move upstream, from the lagging number to the leading signals, the experience problems that push customers toward the door before they walk through it. That means measuring the experience itself, not just the outcome.
Two methods do this well, and they work best together.
Mystery shopping sends trained evaluators through the real customer journey, so you see what your customers actually encounter. The slow account opening at one branch, the upsell that never happens, the checkout that frustrates, the standard that looks fine in the manual but breaks on the floor. It catches the gap between the experience you think you deliver and the one customers get. Location by location.
Voice of Customer (VoC) captures what customers say in their own words, across surveys, reviews, and support conversations, so recurring complaints and rising frustrations surface as patterns rather than one-off grumbles.
Put together, these turn a churn number into a diagnosis. The metric tells you people are leaving. Mystery shopping and VoC tell you which broken touchpoints are sending them. So you can fix the cause instead of guessing. Used as early-warning signals, they also let you see trouble in the experience scores before it shows up as lost customers, which is the whole point. It is far cheaper to fix a failing branch than to win back the customers it drove away.
Retention levers that actually move churn
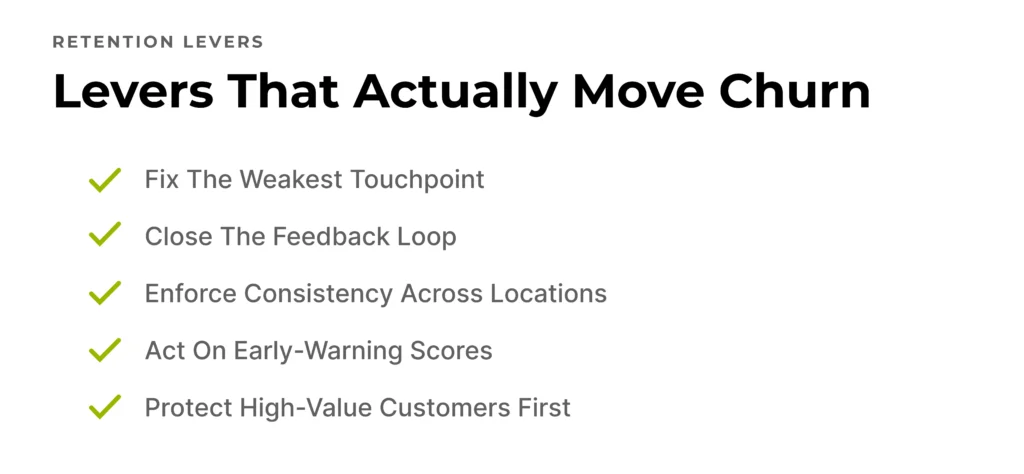
Once you know the drivers, the fixes get specific. The levers that reduce churn are almost always experience levers, not discounts.
- Fix the touchpoints that push people out: Onboarding, wait times, complaint handling, and digital friction are the usual suspects. Find the worst ones with mystery shopping and VoC, then fix them in order of impact.
- Close the loop on feedback: Route complaints to the person who can act, fix the issue, and tell the customer you did. A customer whose problem gets solved often stays more loyal than one who never had a problem.
- Enforce consistency across locations and channels: Churn often hides in a handful of underperforming sites dragging the average. Mystery shopping makes standards measurable, so the weak locations get seen and coached.
- Act on early-warning scores: Treat falling CSAT or mystery shopping scores in a region as a churn forecast, and intervene before the customers leave.
- Prioritize your highest-value customers: Because revenue churn matters more than logo churn, protect the accounts and segments worth the most first.
None of this needs a data-science team. It needs the experience measured honestly and the results put in front of the people who can act on them.
What this means for banking, retail, and hospitality
Churn looks different depending on whether customers are contracted to you.
For banks, insurers, and subscription businesses, churn is contractual and visible. A customer cancels, and you can measure it directly. The drivers tend to sit in service quality, onboarding, and how complaints and compliance are handled, all of which mystery shopping and VoC measure well.
For retail, hospitality, and F&B, there is usually no contract to cancel, so “churn” is really a drop in repeat purchase. Nobody formally quits your restaurant; they just stop coming. Here the signal to watch is repeat-visit rate, frequency, and the size of your lapsed-customer segment, and the experience drivers are consistency and service across every location. A regular is lost the same way a subscriber is, one bad experience at a time, but it happens without any cancellation to log.
In both cases the pattern is the same. The number tells you the loss. The experience tells you the reason.
Common mistakes to avoid
- Treating the churn rate as the diagnosis. It is the symptom. The cause is in the experience.
- Only counting customers, not revenue. Logo churn and revenue churn can point in opposite directions. Track both.
- Waiting for the number to move before acting. By then the customers are gone. Watch leading experience scores instead.
- Fixing the average, not the outliers. Churn often concentrates in a few weak locations or segments. Find them.
- Assuming low churn means happy customers. Contracts and switching costs can keep unhappy customers in place, for a while.
Stop guessing why customers leave
A churn rate is worth tracking, but on its own it only ever confirms the bad news after the fact. The customers you can still save are the ones showing early signs in the experience right now, the slow branch, the ignored complaint, the location quietly slipping below standard. Find those, fix them in order of impact, and the number follows.
That is where Checker helps. We measure the experience behind the metric, mystery shopping across every location and Voice of Customer in your customers’ own words, on one platform, with real-time role-based dashboards that get the right signal to the person who can act on it. During 20 years doing this for banks, retailers, and hospitality brands means we know the difference between a churn report and a churn fix.
Find out why your customers are really leaving. Book a free consultation, and we’ll help you map the experience drivers behind your churn and where to act first.
Frequently asked questions
It depends heavily on your industry and business model. So compare yourself to your own trend and close peers rather than a universal benchmark. Contractual businesses like banking and subscriptions usually track a low single-digit monthly or annual churn, while non-contractual retail and hospitality measure repeat-purchase decline instead. The more useful question is not “is our number good” but “do we know why customers are leaving.”
Divide the number of customers lost during a period by the number you had at the start of that period. If you begin a quarter with 2,000 customers and lose 160, your quarterly churn rate is 160 / 2,000, or 8%. Keep the calculation consistent period to period, and decide up front whether to include customers who both joined and left within the same period.
Customer churn counts how many customers you lost. Revenue churn weights that by how much those customers were worth. Losing many small customers and losing a few large ones can produce the same customer-churn percentage but very different revenue impact, which is why revenue churn is usually the more important figure.
Averaged scores can hide the problem. A strong overall CSAT can mask a few failing locations or a broken touchpoint that only some customers hit. It can also lag, or reflect customers who stay under contract while planning to leave. Digging into the experience with mystery shopping and open-text feedback usually finds the specific gap the average is hiding.
A churn rate tells you customers are leaving but not why. Mystery shopping shows what customers actually experience at each touchpoint and location, and VoC captures what they say in their own words. Together they identify the specific experience gaps driving people away, so you can fix causes early instead of reacting to the loss after it happens.


