


Your CSAT dashboard says 81%. Last quarter it said 82%. The quarter before that it was 80%. Leadership asks what the team is doing to move it, and the honest answer is that nobody knows which lever to pull. So the store managers get a reminder email, someone rewrites the survey question, and next quarter the number lands at 81% again.
That’s the common story with CSAT scores. The metric is simple, cheap to collect, and easy to report. It’s also very good at telling you that customers were unhappy and almost useless at telling you why. Without the why, every improvement plan is a guess, and guesses rarely move a number.
This guide covers how to calculate CSAT properly, how to run the survey so the score means something, how to benchmark it by industry without fooling yourself, and how to find the reasons behind a low score so you can actually lift it.
What is a CSAT score?
A CSAT (customer satisfaction) score is the percentage of customers who say they were satisfied with a specific interaction, product, or experience. You usually measure it with one question on a 1 to 5 scale, then divide the number of satisfied answers (4s and 5s) by the total number of answers.
CSAT is a short-range metric. It captures how someone felt about a moment: a branch visit, a hotel stay, a delivery, a support call. That makes it the right tool for spotting problems at a specific touchpoint or location. It is the wrong tool for measuring long-term loyalty or how hard you made someone work.
That’s why it usually sits alongside two other metrics.
| Metric | The question it asks | What it’s best at |
| CSAT (Customer Satisfaction Score) | “How satisfied were you with your visit today?” | Judging a specific interaction or touchpoint |
| NPS (Net Promoter Score) | “How likely are you to recommend us to a friend?” | Tracking overall relationship and loyalty |
| CES (Customer Effort Score) | “How easy was it to get your issue resolved?” | Finding friction in a process |
None of these replaces the others. If your question is “which of our 40 stores is letting customers down at checkout,” CSAT is the one to use.
How to calculate your CSAT score with a worked example
The standard formula counts only the top two answers as satisfied.
CSAT = (number of 4 and 5 responses / total responses) x 100
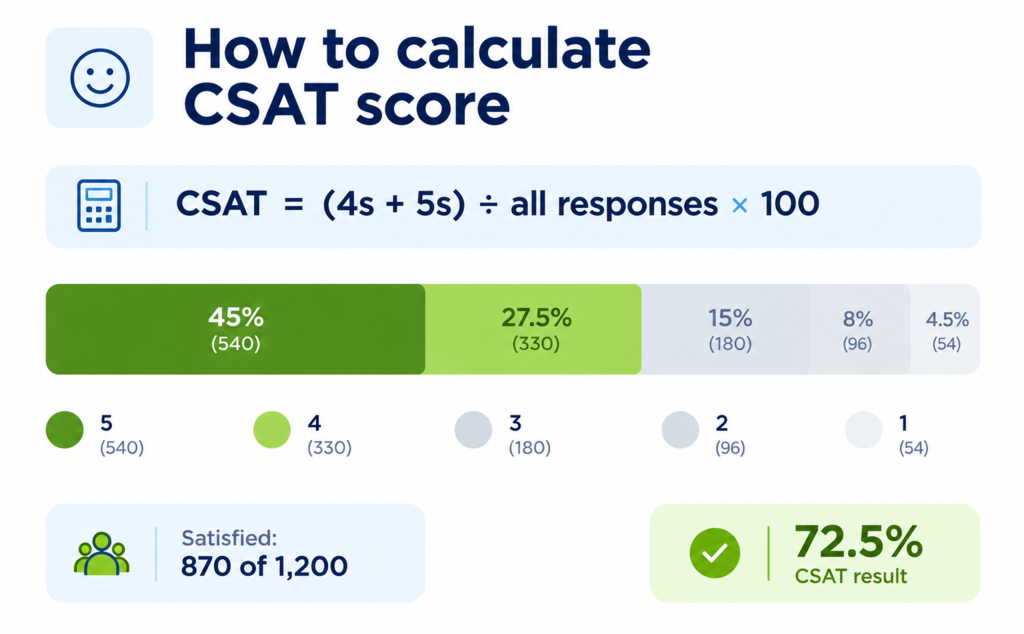
Say a hotel group collects 1,200 post-stay surveys in March. The answers break down like this:
| Rating | Responses |
| 5 (very satisfied) | 540 |
| 4 (satisfied) | 330 |
| 3 (neutral) | 180 |
| 2 (dissatisfied) | 90 |
| 1 (very dissatisfied) | 60 |
| Total | 1,200 |
Satisfied customers are 540 + 330 = 870. So CSAT is 870 / 1,200 x 100, which gives 72.5%.
Some teams report the average rating instead. On the same data that’s 4,800 points / 1,200 responses, so 4.0 out of 5. Both numbers are legitimate, but they are not interchangeable. Pick one method, label it on every dashboard, and never switch halfway through a year. Otherwise, you’ll spend a board meeting explaining why “satisfaction dropped from 4.0 to 72.5.”
Notice the 180 neutral answers. That’s 15% of guests who weren’t unhappy enough to complain and weren’t happy enough to count. In our experience, this middle group is the easiest to move, and it’s usually ignored because a 3 doesn’t trigger any alert.
How many responses you need before a score means anything
This is the part most CSAT reports skip, and it’s the reason many scores look like they “won’t move” or jump around at random.
Every CSAT score carries a margin of error, and it shrinks as responses grow. At a score around 72.5%, the approximate 95% margin of error looks like this (simple random sample assumed):
| Responses | Margin of error (approx.) |
| 50 | plus or minus 12 points |
| 100 | plus or minus 9 points |
| 400 | plus or minus 4.4 points |
| 1,200 | plus or minus 2.5 points |
So the group-level 72.5% is fairly solid. However, a single hotel with 50 responses a month could swing from 65% to 78% without anything real changing. If you coach, reward, or blame a location manager on that swing, you’re reacting to noise. Look at rolling three-month figures for small locations, and treat a change as real only when it holds.
How to run a CSAT survey customers actually answer
A good score starts with a good survey. Most bad CSAT data comes from asking the wrong thing, at the wrong time, of the wrong people.
What to ask
Keep it to one rating question and one open question. For example:
- “How satisfied were you with your visit to our Lyon branch today?” (1 very dissatisfied to 5 very satisfied, every point labelled)
- “What’s the main reason for your score?”
Name the specific interaction. “How satisfied are you with us?” blends the product, the price, the parking, and the person at the counter into one number you can’t act on. Label every point on the scale, because unlabelled middle points get read differently by different people. And keep the open question, since it’s the only place the “why” gets a chance to appear.
If you add anything more, make it one driver question at most. Completion drops quickly as surveys grow.
When to ask
Ask as close to the moment as you can. Satisfaction memory fades and gets rewritten by whatever happened next. In practice that means:
- Retail, banking branches, and F&B: the same day, ideally within a couple of hours of the visit.
- Hotels: at or just after checkout, while the stay is still fresh.
- Support and contact centers: right after the issue is resolved, not after the first contact.
- Deliveries and installations: once the job is complete, not when the order ships.
Avoid asking mid-experience (“rate us so far”) and avoid asking about the whole relationship right after a single transaction. That’s NPS territory.
Where to ask
Each channel has a trade-off.
- SMS reaches people fast and works well for branch and store visits.
- Email gets fewer responses but longer, more useful comments.
- QR codes on receipts are cheap but only reach people who bought something.
- In-app prompts work for digital journeys and can fire the moment a task finishes.
- Tablets and kiosks at the exit collect volume, but staff can see them and influence them.
- Automated phone surveys suit contact centers and customers who don’t use email.
Most multi-site brands end up mixing two or three. That’s fine, as long as you track the channel on every response, because scores differ by channel and a shift in the channel mix can look like a shift in satisfaction.
Mistakes that quietly bias your CSAT scores
- Score begging. “Anything less than a 5 counts as a fail for me” inflates the number and hides the real experience. It’s common wherever staff bonuses are tied to CSAT.
- Only surveying buyers. Receipt and post-purchase surveys never reach the customer who waited ten minutes, got no help, and walked out. Your unhappiest customers are often missing from the data entirely.
- Surveying the same people too often. Frequent visitors who get a survey every time either stop answering or start clicking 5 to make it go away.
- Changing the question mid-year. A reworded question is a new metric. Restart the trend line or keep the old wording.
How to benchmark CSAT scores by industry
Benchmark CSAT against three things, in this order: your own trend over time, your own locations against each other, and published industry indices. Use the industry figures for direction, not as a target.
Why industry benchmarks are harder than they look
You’ll see a “good CSAT score” of 75% to 85% quoted all over the web. We haven’t found a primary study behind that range, and it hides a bigger problem. Your CSAT depends on your scale (1 to 5 or 1 to 10), your method (top-2-box or average), your channel, your timing, and who gets surveyed. Two banks with identical service can report scores ten points apart simply because one texts customers an hour after the visit and the other emails them a week later.
So comparing your 72.5% to someone else’s 80% tells you very little unless you know they measured it the same way.
Where to find credible industry benchmarks
The most reliable outside reference points are national satisfaction indices. They survey customers the same way across companies and sectors, which makes them comparable to each other, though not directly to your own CSAT.
| Index | Coverage | How to use it |
| American Customer Satisfaction Index (ACSI) | US, run since 1994, originally developed at the University of Michigan | Sector trends and which industries lead or lag |
| UK Customer Satisfaction Index (UKCSI) | UK, published twice a year by the Institute of Customer Service | Sector rankings and what drives satisfaction in the UK |
| EPSI Rating | Independent satisfaction indices across several European markets | Country and sector comparisons in Europe |
These indices report on a 0 to 100 scale built from several questions. That’s a different instrument from a single top-2-box question, so don’t put an index score of 76 next to your 72.5% as if they were the same thing. Use them to answer questions like “is satisfaction in our sector rising or falling,” “where does our sector sit against others,” and “what do leading sectors seem to get right.”
What drives CSAT in different industries
Even without a universal number, the drivers differ by sector, and knowing them tells you where to look first.
| Industry | What usually moves CSAT | Common blind spot |
| Retail | Staff availability, queue time, product availability, returns | Customers who leave without buying never get surveyed |
| Banking and insurance | Clarity of explanation, wait time, competence, follow-through | Advice quality and compliance steps the customer can’t judge |
| Hospitality | Check-in, room condition, staff warmth, problem recovery | One bad moment outweighs an otherwise good stay |
| F&B and QSR | Speed, order accuracy, cleanliness, consistency | Peak-hour performance hidden by off-peak averages |
| Automotive dealerships | Honesty in sales, service turnaround, handover quality | Sales and aftersales scored together, masking which one fails |
Build an internal benchmark first
For a multi-site brand, the most useful benchmark is usually your own network. Rank locations by rolling CSAT, split them into quartiles, and ask what the top quartile does that the bottom quartile doesn’t. That comparison uses the same survey, the same method, and the same customers, so the differences are real.
The catch is that CSAT alone can show you the gap between your best and worst stores. It can’t show you what the best ones actually do differently. That takes a different kind of measurement.
Why CSAT tells you the “what” and mystery shopping tells you the “why”
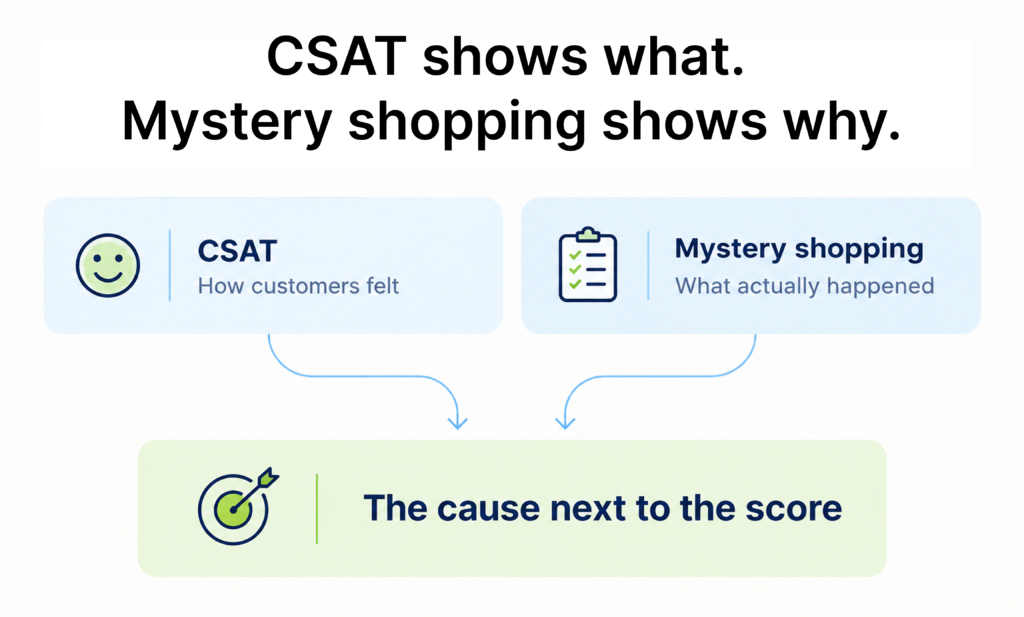
CSAT measures an outcome, how the customer felt. Mystery shopping measures the delivery, what actually happened, checked against your standards, the same way at every location. One is perception, the other is observation, and you need both to fix anything.
| Question | Can CSAT answer it? | Can mystery shopping answer it? |
| Were customers satisfied at this branch? | Yes | Partly |
| Was the customer greeted within the target time? | No | Yes |
| Did the advisor explain fees and terms correctly? | No | Yes |
| How long was the queue at 12:30 on a Saturday? | No | Yes |
| Did staff follow the complaint-handling process? | No | Yes |
| What did customers say in their own words? | Yes (open text) | No |
Here’s what that looks like in practice. Two bank branches both score 78% CSAT. A mystery shopping wave shows the first branch hits nearly every service standard, but customers wait far too long at lunchtime. The second branch has short queues, yet advisors routinely skip the needs assessment and push the same product.
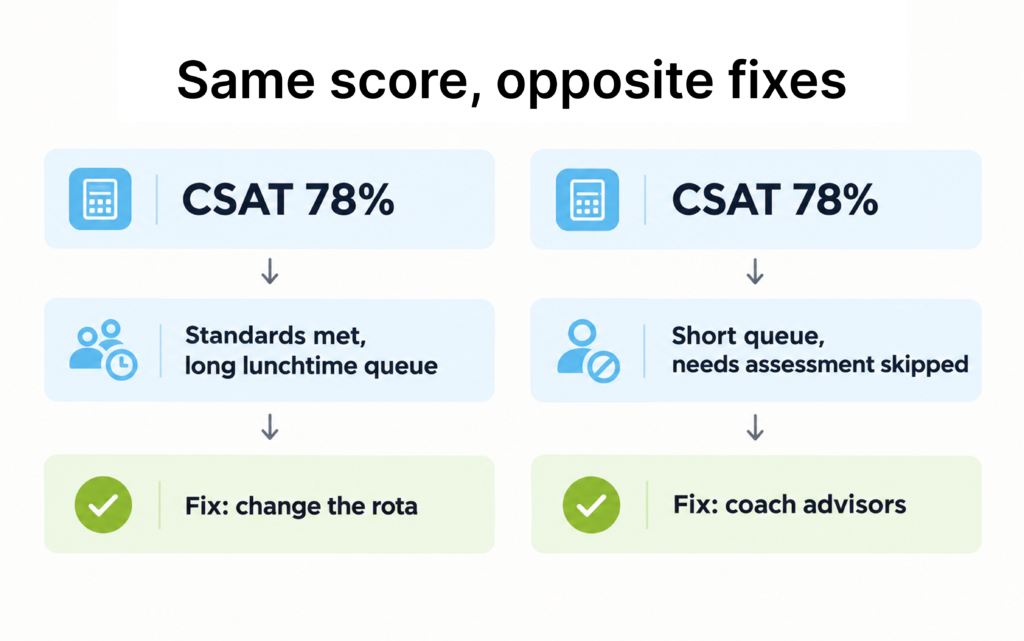
Same score, completely different problems, and opposite fixes. One needs rota changes. The other needs coaching. A CSAT dashboard would have sent both managers the same “please improve” email.
How to use CSAT and mystery shopping together
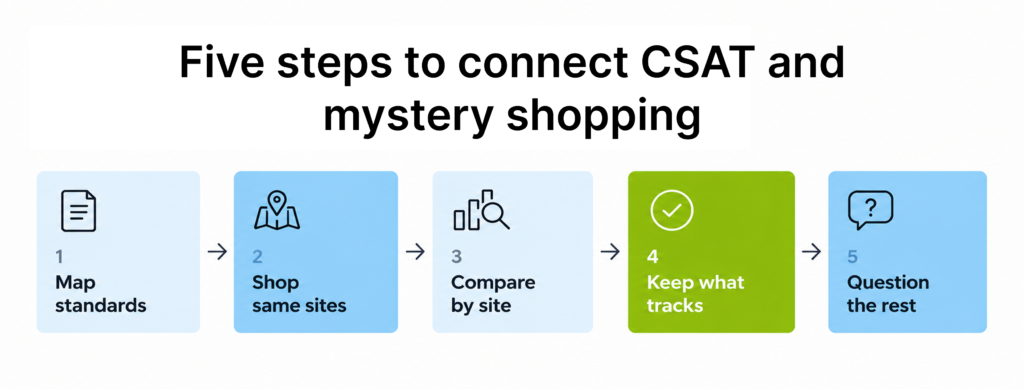
- Map your service standards to journey stages. Greeting, needs discovery, explanation, closing, follow-up. Keep each standard observable.
- Run mystery shopping on the same locations you survey, in the same period, so the two datasets line up.
- Compare location by location. Put each site’s mystery shopping compliance score next to its CSAT.
- Find the standards that track with satisfaction. Where compliance with a standard rises and CSAT rises with it, that standard matters to customers. Coach it hard.
- Question the standards that don’t. If locations that perfectly follow a script score no better, the script may matter to head office more than to customers.
To be fair to both methods, mystery shopping has limits too. Each wave is a snapshot, usually a few visits per location, and evaluators are trained observers rather than your real customers. CSAT gives you volume and the customer’s voice; mystery shopping gives you precision and the cause. Used together, they cover each other’s blind spots.
Why CSAT scores stall
Before fixing a low score, it helps to know why so many CSAT programs flatline. From what we see across programs, it usually comes down to four things:
- Teams manage the average, not the outliers. A network score of 81% can hide five locations at 60% and dozens at 85%. Improvement plans aimed at “everyone” dilute effort where it isn’t needed.
- Nobody knows the cause. Without the why, teams fix whatever is visible or easy, not what customers actually mind.
- Small samples create false signals. Managers chase monthly swings that are only noise, so real problems get lost among fake ones.
- The score gets gamed. Once CSAT is tied to bonuses, score begging rises, and the number drifts away from the experience it was meant to measure.
Each of the fixes below targets at least one of these.
How to improve a low CSAT score
Find where the score is lost
- Break the score down before you act. Split CSAT by location, journey stage, channel, and time of day. Most low scores come from a few touchpoints or sites, not from everything at once.
- Read the open-text comments first. Before changing anything, read what the 1s, 2s, and 3s actually wrote about the weakest touchpoint. Patterns show up quickly, and they often contradict what management assumed.
- Go after the neutral 3s. They are closer to satisfied than your detractors, so small fixes (a proper greeting, a clear explanation, a quick follow-up) can tip them into the 4s and 5s.
- Close the loop on every 1 and 2. Alert the location manager automatically, contact the customer within a working day or two, fix what can be fixed, and record what was done. A problem that gets solved often wins back more goodwill than a visit where nothing went wrong.
Fix the behavior behind it
- Turn findings into standards staff can actually follow. “Be friendly” can’t be trained or checked. “Greet every customer within 30 seconds of entry” can. Then use mystery shopping to verify it happens at every location.
- Coach with evidence, not league tables. Show a manager their mystery shopping report and their customers’ comments side by side. Ranking stores publicly without the why creates defensiveness, not improvement.
- Remove effort. Shorter queues, fewer handoffs, and not making customers repeat themselves lift satisfaction across almost every sector.
- Stop score begging, and don’t tie bonuses to CSAT alone. If you reward the score, you’ll get the score. Balance it with mystery shopping results so staff are rewarded for the behavior that produces satisfaction.
- Put the right score in front of the right person, fast. A store manager needs their own location’s results, today, not a network PDF next month. Real-time, role-based dashboards are what turn CSAT from a report into a daily tool.
- Re-measure and keep the method fixed. After a fix, watch the rolling score and the mystery shopping compliance for that standard. If both move, you found a real lever.
None of this needs a data science team. It needs honest measurement, the cause next to the score, and results in the hands of people who can act on them.
Stop guessing why your CSAT scores are low
A CSAT score is worth tracking. It’s fast, cheap, and your customers understand the question. But on its own it only tells you what happened, and a number without a cause is why so many CSAT scores sit in the same place quarter after quarter. Fix the measurement, break the score down, and put the why next to it. And that’s when the number starts to move.
That’s the work Checker supports. CSAT and VoC surveys across SMS, email, phone, web, and field channels, mystery shopping on the same platform, and real-time, role-based dashboards that show each manager their own locations. Everything runs on our own technology, with GDPR-grade data handling for European programs, and 20+ years of field experience behind the way we set it up.
Want to know what’s really behind your CSAT scores? Contact us for more insights, and we’ll walk you through how to set up CSAT and mystery shopping side by side for your locations.
Frequently asked questions
There’s no universal number, because CSAT depends on your scale, calculation method, channel, and timing. The 75% to 85% range often quoted online has no clear primary source. A more useful test is whether your score is stable or rising over time, how your locations compare with each other, and how your sector is trending in national indices like the ACSI or UKCSI.
Divide the number of satisfied responses (4s and 5s on a 1 to 5 scale) by the total number of responses, then multiply by 100. For example, 870 satisfied responses out of 1,200 gives a CSAT score of 72.5%. Some teams report the average rating instead, so always label which method you use and keep it consistent.
CSAT measures satisfaction with a specific interaction, such as a visit, stay, or support call. NPS measures how likely customers are to recommend you, which reflects the overall relationship. CSAT is better for finding problems at a touchpoint or location; NPS is better for tracking loyalty over time.
As soon as possible after the interaction you’re measuring. Store, branch, and restaurant visits are best surveyed the same day. Hotels should ask at or just after checkout, and support teams once the issue is resolved. Delayed surveys produce lower response rates and less accurate answers.
More than most location-level reports use. At around 50 responses, a CSAT score carries a margin of error of roughly plus or minus 12 points, so month-to-month swings are often noise. Around 400 responses brings that to about plus or minus 4 points. For small locations, use rolling three-month figures.
Yes, by showing why a score is low. CSAT tells you how customers felt, while mystery shopping checks what actually happened against your service standards at each location. Comparing the two shows which standards drive satisfaction, so you can coach the behaviors that matter and verify they happen.


